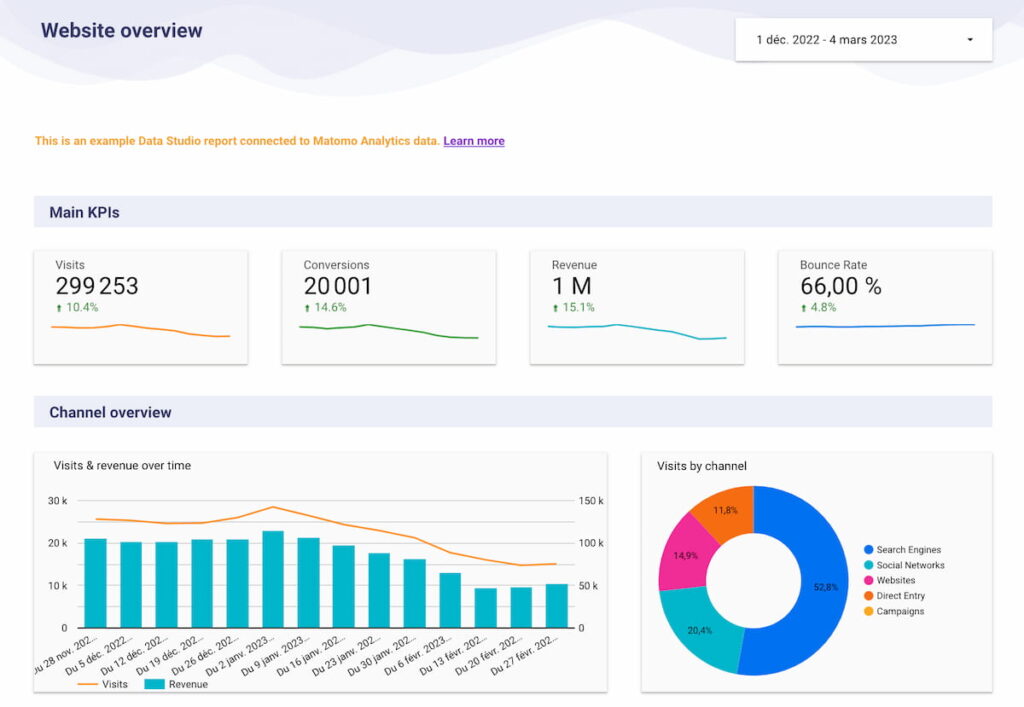
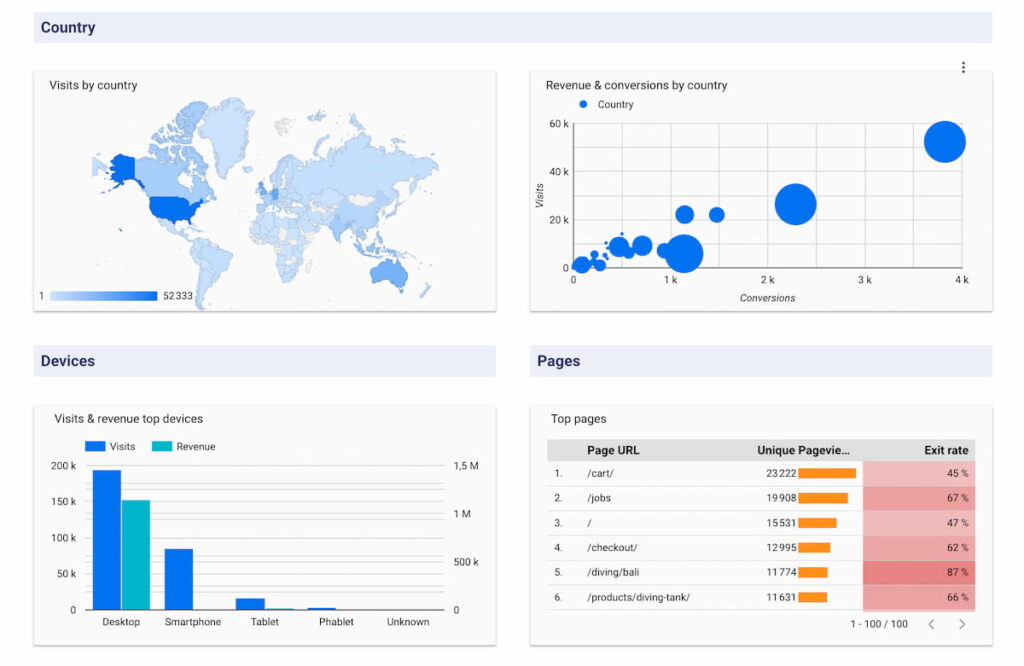
If you’re looking to create a monitoring dashboard for your web performance using Looker Studio (DataStudio) and Matomo Analytics as your data source, we have a free template that you can copy and adapt. This template was created by Michael Weber, the developer of the Matomo Google Looker connector, to help you save time on integration.
Matomo Analytics Looker Studio Dashboard Template
This template allows you to easily generate custom reports and visualizations based on your Matomo Analytics data. The dashboard is fully customizable, allowing you to add your own metrics and dimensions, change chart types and styles, and adjust the layout to suit your specific needs.
Using the Looker Report Template with Matomo Analytics Data

To use the Looker report template with your own Matomo Analytics data, follow these steps:
- Create the following five data sources:
- Report: Channel Type
- Report: Key Metrics
- Report: Country
- Report: Device Type
- Report: Actions – Page URL
Ensure that you name the data sources meaningfully.
- Open the free template provided by Michael Weber.
- Click on “More options” (three dots at the top right) and select “Copy report”.
- Choose the data sources you created in step 1.
- Modify the reports as needed, making any necessary adjustments or customizations to fit your requirements.
By following these steps, you can easily create a monitoring dashboard using Looker Studio (DataStudio) and Matomo Analytics, tailored to your specific web performance tracking needs.


